
In Episode 4 of the Better System Trader podcast, Nick Radge discusses some trading ideas he’s used to create profitable systems. He mentions a Bollinger Band idea which is also published in his book Unholy Grails. Nick says:
the strategy that we did test and showed very promising results was an entry using a Bollinger band and an exit using the opposite Bollinger band, but we use 3 standard deviations for the entry and 1 standard deviation for the exit, just to keep the trailing stop a little bit tighter.”
In Unholy Grails the strategy is used on the Australian stockmarket but in this article we’re going to test it on the Nasdaq 100 instead to determine if the strategy has potential in other markets.
The trading rules
Firstly, here are the test parameters:
- Period: Daily charts
- Universe: Nasdaq 100, using historical constituents to eliminate survivorship bias, data from Premium Data
- Test period: From 1/1/2005 to 1/1/2015. This period was chosen because it has a mix of bull and bear markets, along with high and low volatility
- Starting equity: $100,000
- Maximum number of simultaneous trades: 6
- Position size: Each position will be 1/6th of $100,000
- Compounding profits: No
- Commissions: $10 each way
- Leverage: 0%
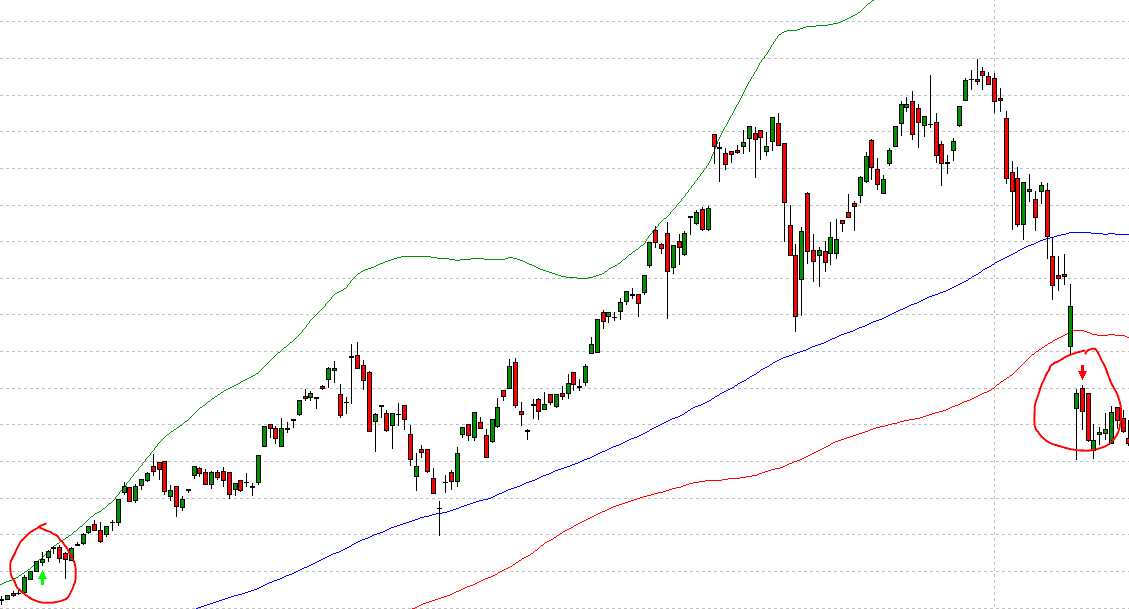
Now for the entry and exit rules. In Nicks book, he uses 100 period Bollinger Bands so we’ll do the same. The upper Bollinger Band will be 3 deviations from the central line, the lower Bollinger Band will be 1 deviation below the central line.
Entry: Buy on the Open the day after a stock closes above the top Bollinger Band
Exit: Exit on the Open the day after a stock closes below the lower Bollinger Band
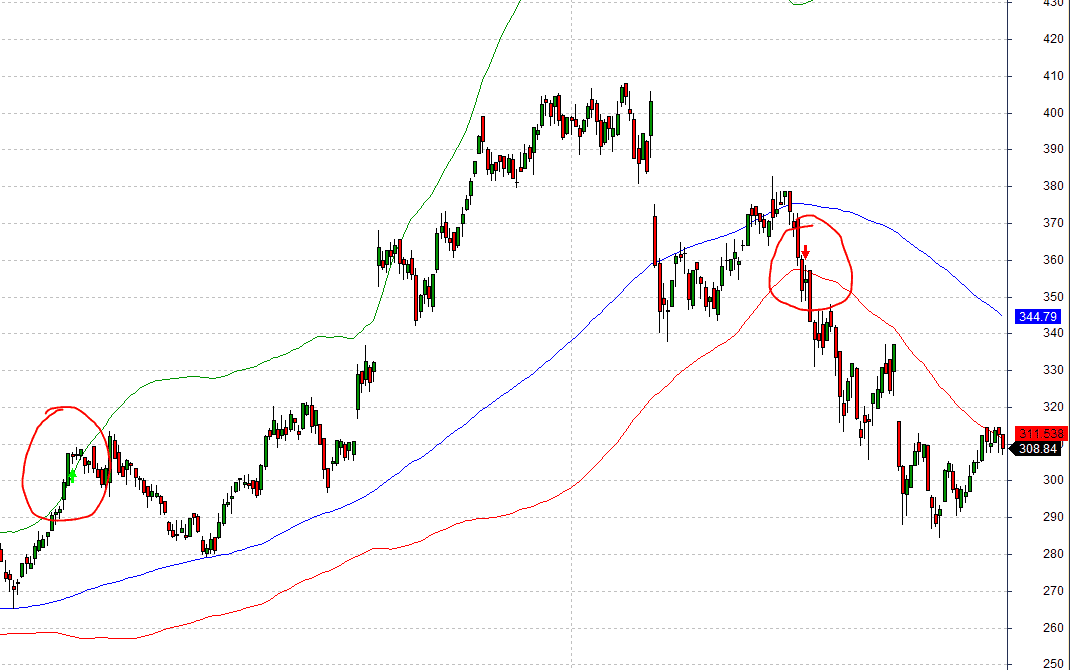
Here is an example of an entry (10/05/2007) and exit for AAPL:
Comparing the results of the basic Bollinger Band strategy to Buy & Hold:
[table] ,Buy & Hold,Basic strategy
Annual Return (CAR)%,9.88%,11.83%
Max Drawdown (MDD),-52.81%,-21.80%
CAR/MDD,0.19,0.54
Transactions,1,81
Win %,n/a,71.60%
Win/Loss Ratio,n/a,2.40[/table]
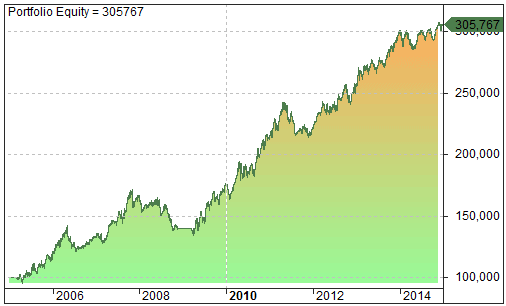
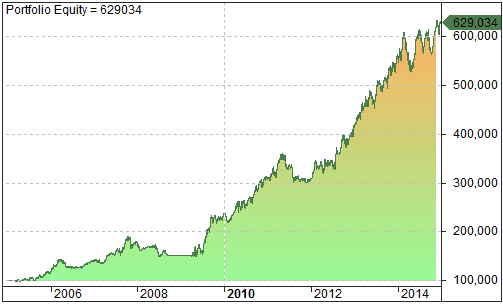
The annual return of the basic strategy is almost 20% better than Buy & Hold with less than 1/2 the drawdown. The equity curve of the basic strategy shows a general rise in equity with a few periods of drawdown:
Adding a market filter
A market filter is used to switch a strategy on or off based on broader market conditions. As this is a long only system we probably don’t want to enter trades in a bear market so we’ll only enter trades when the index is rising. With the S&P 500 the most frequently used index by financial professionals, we’re going to use that for the index filter.
In this test a bull market will be defined as the index closing above the 100 day simple moving average; when the index closes below the 100-day moving average it is a bear market and we won’t enter trades until prices closes back above the 100 day moving average. The 100 day moving average was chosen to match the Bollinger Band value, other moving average lengths may work better but will need to be tested. The results:
[table] ,Buy & Hold,Basic strategy,Basic strategy with Index filter
Annual Return (CAR)%,9.88%,11.83%,13.01%
Max Drawdown (MDD),-52.81%,-21.80%,-17.95%
CAR/MDD,0.19,0.54,0.73
Transactions,1,81,73
Win %,n/a,71.60%,64.38%
Win/Loss Ratio,n/a,2.40,3.66[/table]
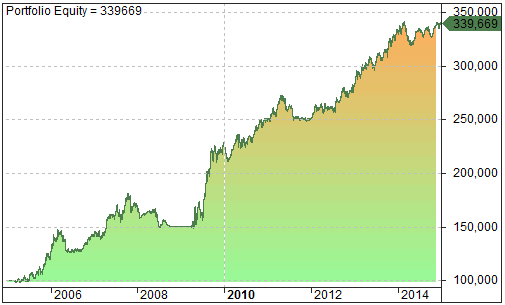
The index filter has improved the quality of the strategy, with a higher return, lower drawdown and higher win/loss ratio with fewer trades.
There are periods during the test where more trade entry signals are presented than we can take using a maximum of 6 positions, so we need to decide which stocks to choose when this happens.
Let’s try a basic ranking strategy in order to systematise the selection process.
Ranking
When a number of stock entries occur on the same day we need to make a decision on which ones to take. We could choose them randomly but we would need to run monte carlo simulations to get a better indication of the possible variations using this method. I prefer to add a simple ranking system to the strategy so stock selection is completely systematic.
The ranking strategy I’m going to use here is based on what I think the strategies strength is. I expect the strategy will perform best either just after a bear market or a period of consolidation, entering at the start of a new bull market or breaking out of consolidation and riding it higher. In this case, we’re going to try ranking by Rate of Change over the last 90 days, so the stocks with the smallest Rate of Change will have a higher priority than those with a large Rate of Change. Logically it makes sense but what do the results tell us?
[table] ,Buy & Hold,Basic strategy,Basic strategy with Index filter,Basic strategy with Index filter and smallest ROC ranking
Annual Return (CAR)%,9.88%,11.83%,13.01%,13.82%
Max Drawdown (MDD),-52.81%,-21.80%,-17.95%,-17.54%
CAR/MDD,0.19,0.54,0.73,0.79
Transactions,1,81,73,68
Win %,n/a,71.60%,64.38%,72.06%
Win/Loss Ratio,n/a,2.40,3.66,3.31[/table]
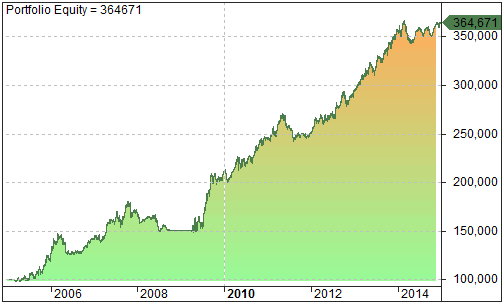
The ranking strategy produced a higher annual return, with lower drawdown, a lower number of trades and a higher win %. It may have not impacted too many trades so the addition of the ranking may not be statistically significant but it does provide a systematic method to choosing stocks when multiple opportunities present themselves.
The power of Compounding
So far we’ve seen the basic strategy slightly outperforms Buy & Hold but with considerably lower drawdowns. The inclusion of an Index Filter and ranking by smallest ROC has improved the strategy although the results aren’t outstanding.
Let’s see how compounding profits impacts strategy results:
[table] ,Buy & Hold,Basic strategy,Basic strategy with Index filter,Basic strategy with Index filter and smallest ROC ranking,Basic strategy with Index filter and ROC ranking & profits compounded
Annual Return (CAR)%,9.88%,11.83%,13.01%,13.82%,20.20%
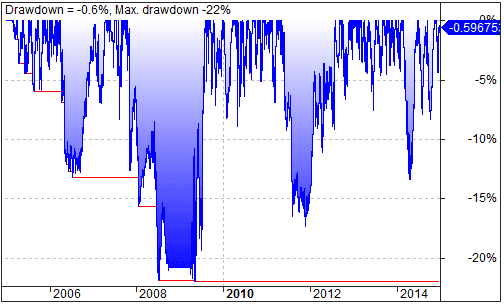
Max Drawdown (MDD),-52.81%,-21.80%,-17.95%,-17.54%,-21.93%
CAR/MDD,0.19,0.54,0.73,0.79,0.92
Transactions,1,81,73,68,60
Win %,n/a,71.60%,64.38%,72.06%,73.33%
Win/Loss Ratio,n/a,2.40,3.66,3.31,3.33[/table]
Update 27/4 – As requested by Rick, here is a histogram of distributions, with the majority of trades in the -25 to +70% range and a few trades with 100% and higher:
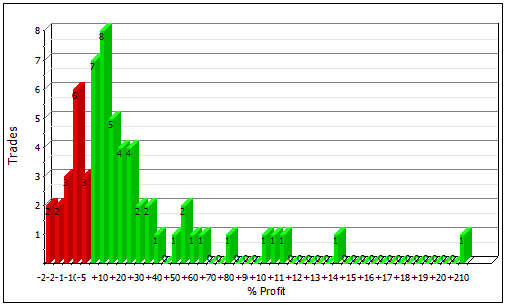
With compounded profits we now have a strategy that produces more than double the returns of Buy & Hold with only half the drawdown. The win rate of 73.33% and win/loss ratio of 3.33 are also good for a trend following system.
It appears the strategy has some potential and warrants further investigation. Some areas of consideration could be:
- The length of the Bollinger Bands,
- Different market filters,
- More adaptive trailing stops,
- Ranking based on other metrics,
- Suitability to other markets.
Like a copy of the AmiBroker code?

Want to get the latest updates automatically?
The best way to get notified when new stuff is released is to sign up to the email list below and we’ll be sure to let you know:
[mc4wp_form]
