
Most traders spend years searching for the perfect indicator or system. Rob Hanna takes a different approach. Instead of chasing complex solutions, he builds a library of simple, tested market observations and layers them together when they align. The result is a quantified, evidence-based edge that has held up for years at his service Quantifiable Edges.
Rob Hanna has been a full-time market professional since 2001. He began publishing his market views and research in 2003, writing twice a week on TradingMarkets.com through 2007. He launched two websites using historical analysis to assess current market action, utilising price action, volume, breadth, sentiment, seasonality, and liquidity flows. His 2010 quant study on Fed days received wide attention across the industry. In episode 7 of the Better System Trader podcast, Rob shares how he generates trading ideas, what he actually looks at in a backtest, and how multiple edges working together can improve trading results.
Watch the full episode below, then read on for the complete breakdown.
Where Rob’s trading ideas come from
Rob’s process for generating ideas is simpler than most expect. He looks at what the market did that day and describes it in objective terms. Was it down 1%? Did it hit a 10-day low? Was breadth weak? Was volume high or low? Each of those descriptions becomes a potential study.
He explained it this way: “Just look at what the market did today and describe it. Oh, it was down 1%. It hit a 10-day low, or it’s coming off of a 50-day high. Breadth was this. Volume was high or volume was low. Anything you use to describe the market action, you can then test.”
The goal is to build a daily habit of observation. Once you have a description, you have a hypothesis. From there, you test it. Over time this produces a library of market studies that reflect current conditions in a systematic way.
The QuantiFinder: managing a library of edges
Rob built a custom software tool he calls his QuantiFinder. Each evening it scans his library of past studies and surfaces any that match current market conditions. If a study showed a historical edge in situations matching today’s setup, he gets notified and retests it against recent data before making any trading decisions.
Critically, he never relies on the original backtest. “I always retest. I never trust what I did in the past because the market’s always evolving and you gotta adapt to it.” This habit of continual retesting distinguishes his approach from simply curve-fitting a database of historical patterns.
What the profit curve tells you that the numbers cannot
When Rob evaluates a study, most traders would focus on win rate, profit factor, and average trade. Rob’s primary focus is the profit curve, and this is one of the most useful ideas in the episode.
“The numbers only tell a part of the story. Looking at the profit curve lets me know if it’s been a steady edge over a long period of time, or whether it’s something that is getting stronger as of late and it wasn’t really an edge five or ten years ago.”
He gave a concrete example: a study might show great numbers looking back 10 years, but if you zoom into the last 5 years the edge is flat. That’s a meaningful red flag. Conversely, a study that shows consistent improvement over a long time frame, across changing market conditions, is a much stronger candidate for trading.
Less than 5% of published studies are direct trade signals
Rob publishes a large number of studies on Quantifiable Edges. Many traders assume each one is a trading signal. They are not. He estimates fewer than 5% of the studies he posts are things he would act on based on that information alone.
The others serve a different purpose: they contribute to his market bias. If three or four studies are all pointing bullish on the same day, that confluence raises his confidence. No single study gives him a position. The combination of aligned edges does.
“I will try and look at things from a number of different angles. So if I publish a bullish study, that means there is a bias based on that information. Then I look for other studies to support or counter that view before taking action.”
Monday: a 27-year edge that changed after Black Monday
One of the most compelling examples in the episode involves something as simple as the day of the week. Rob found that from 1961 through to the 1987 crash, Mondays were consistently poor for the S&P 500. The pattern held for 27 years.
“If you just went short every Friday and then got long again on Monday, you’d be a heck of a lot better off. Or maybe take a three-day weekend if you’re a trader, and don’t even work Mondays.”
After the 1987 crash, the pattern changed. Mondays started performing in line with the rest of the week. More recently, they have shown another shift: not terrible, but not participating in rallies either. The takeaway is that market character changes over time. Edges that worked for decades can fade. Monitoring for these changes is part of the job.
Using extremes as the trigger for generating ideas
Rob specifically looks for extremes in the data, not for ordinary market conditions. A five-day low is an extreme. The highest volume in 10 days is an extreme. The tightest trading range in a month is an extreme. Flat, choppy markets without any extreme readings produce fewer useful studies.
“When you hit more extreme situations, that’s when you’re going to see things that stand out. Both the exciting extremes, like the biggest rally in 10 days, and the boring ones, like the tightest range we’ve seen in a month, are both giving you useful information.”
This is a practical filter for where to focus testing effort. Not every day is worth studying in depth, but days with notable extremes carry more informational value.
The catapult system and how one idea spawned a broader research program
Rob’s shift into quantitative research started from a very practical problem. In 2004 he was using O’Neill-style growth stock methods, buying breakouts. The approach worked well in trending markets but failed in choppy conditions and at market tops. The stocks he was riding up were the same ones that got hit hardest when the market turned.
He spent six to eight months studying market tops and bottoms, printing charts and covering his office walls to understand the patterns visually. That research produced a system he calls his catapult system, designed to take advantage of strongly oversold situations. He still uses it today. More importantly, the process of studying market extremes led him to start quantifying everything, which became the foundation of Quantifiable Edges.
Adjusting for Fed meeting days
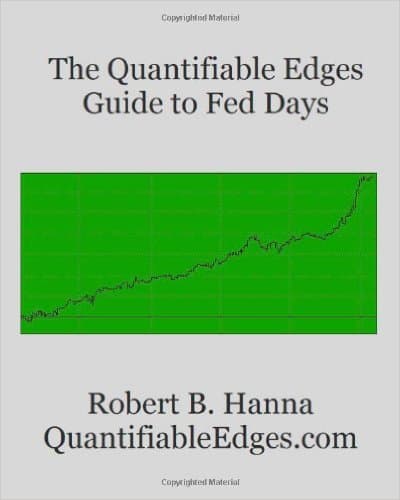
Rob’s 2010 study on Federal Reserve meeting days is one of the more cited pieces of research he has published. The core finding is that Fed meeting days have historically produced a positive bias in the S&P 500, and understanding whether the market is moving into or out of a Fed meeting day provides useful context for setting a daily market bias.
This kind of calendar-based research, combined with price and volume studies, is how he builds up a multi-layered view of any given trading day. No single piece of information is enough, but assembled together they can shift the odds in a meaningful way.
Related episodes
- A new approach to trading volatility – Rob Hanna
- VIX vs SPX: New Volatility Trading Techniques with Rob Hanna
- How to Find Statistical Edges in Trading – Scott Andrews
- How to Leverage Market Biases to Improve Strategy Performance – Lawrence Chan (Episode 204)
Get the show notes & transcript
Want to learn how to find and test your own trading edges? Subscribe to the Better System Trader podcast for weekly interviews with the world’s top systematic traders and quantitative researchers.