David Aronson is a pioneer in machine learning and nonlinear trading system development and signal boosting/filtering.
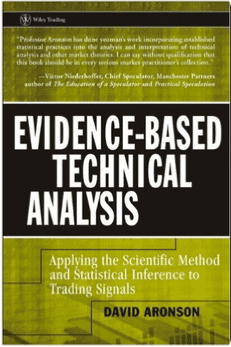
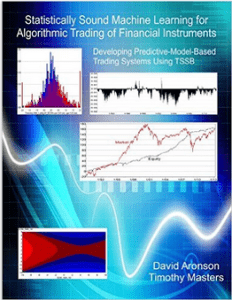
He is author of “Evidence Based Technical Analysis” and his most recent book “Statistically Sound Machine Learning for Algorithmic Trading of Financial Instruments” is an in-depth look at developing predictive-model-based trading systems.
He was also an adjunct professor of finance, regularly teaching MBA and financial engineering students a graduate-level course in technical analysis, data mining and predictive analytics.
In this episode David shares research into the effectiveness of indicators to identify Bull and Bear markets; he’s tested a large number of indicators and combinations with some interesting results! We also discuss issues with data mining, conditions where traditional methods of measuring data mining levels can be problematic and then finish up with the future state of Technical Analysis.
Show your support
While you’re listening, it would be great if you could show your support by leaving a brief review of the podcast in iTunes. This really helps to spread the word and reach even more listeners!
Topics discussed
- What the popular Golden and Death Cross can tell us about the probability of a Bull or Bear market
- Using the RSI indicator to determine market state
- Methods to reduce the lag the 50/200 Moving Average crossover experiences
- Using ADX and Price Variance to identify Bull and Bear markets
- Creating indicators based on the value of other indicators
- Modifying the McClelland Summation Index indicator to identify market states
- How datamining increases the chance of good luck in the results
- Why the White’s Reality Check and Monte Carlo Permutation methods breakdown using certain data-mining approaches
- How the role of Technical Analysis could change over the next 10 years
- New developments in Machine Learning which may see the end of the role of technicians
Resources mentioned in this episode
- David can be followed at his website Tssbsoftware.com or contacted by email.
- If you would like to try the free software David mentions in this episode go to this download page
- Recommended books:
Quotes
Top tips from this episode
Here are few of my favourite takeaways from the chat with David:
- Moving Averages to identify market state – The Golden and Death Cross are often dismissed but David’s research has found that when the 50 day moving average is below the 200 day moving average the probability of a bear market is 4 times higher than the probability when the 50 is above the 200.
- Other indicators – David’s research into hundreds of other indicators has identified RSI, Follow-through indicator, ADX, Price Variance and a modification to the McClelland Summation index to also show potential in identifying market states.
Got A Question, Topic or Guest you want to see on the Podcast?
Do you have a specific question, topic or guest you’d like to see on a future podcast episode?
Click here and submit your suggestion for a chance to have it featured on an upcoming podcast episode.
Get the Transcript
Subscribe to Better System Trader and never miss another episode!
Please support the podcast by giving an honest Rating/Review for the show on iTunes!


