Have you ever started trading a strategy that performs well in the backtests but delivers a very different result when you begin trading it with real money?
Could your backtest reports be fooling you by indicating a strategy is great but really only showing you part of the overall picture?

How do you give yourself a better chance of developing trading systems that are robust and perform well going forward?
Kevin Davey (not the guy pictured above!), World Cup Trading champion from kjtradingsystems.com, has been creating trading strategies for over 25 years. In Episode 5 of the BetterSystemTrader podcast he says:
To reduce the chance this could occur he completes Monte Carlo analysis on all his systems to ensure they are robust and meet his risk requirements BEFORE he puts his money on the line.
What is Monte Carlo analysis and how can it be used to improve your own trading results? Read on, we’re going to show you.
What is Monte Carlo analysis?
Monte Carlo analysis is a process that allows you to get a more accurate picture of the performance of a trading strategy beyond what a standard backtest report can provide.
A backtest report shows the results of a series of trades in a specific order but the problem is that’s just history, you don’t know what’s going to happen going forward. What if a lot of losing trades all show up in a row, what type of drawdown will you experience? What’s the chance that you could get a drawdown larger than expected or a string of losing trades longer than expected?
Monte Carlo analysis basically lets you scramble the order of the trades in a backtest to provide a better understanding of possible future performance, based on the assumption that future trades will have similar characteristics to historical trades but in an unknown order.
The results allow you to determine the probabilities of drawdown and profit levels and the chance your trading account could be completely wiped out.
Is it really that important?
Yes, even the seasoned pro’s like Kevin use it and this is why:
I’ve actually found cases where the walk forward equity curve looked great – probably a lot of people just made the decision, “Hey, I’m going to trade it.” But when I ran the Monte Carlo simulation I found out that there was really a lot more risk in the system and it was a lot riskier than I had anticipated. So basically the amount of return that I was getting compared to the amount of risk I could have, that didn’t necessarily show up in that historical equity curve, was just too much for the profit I was getting and so I basically said, “Well I can’t trade this particular system.”
Using the Monte Carlo analysis tool
Kevin has kindly offered a free copy of the Monte Carlo analysis tool he’s developed in Excel, for all Better System Trader podcast listeners. There is a link to download the tool at the end of this article but let’s first see how it works and how to apply the results to our own trading.
When you open the simulator, there are a few values you need to enter based on your own personal trading parameters. (If it prompts you to enable the macros you will need to say yes otherwise the simulator won’t work).
To setup the simulator enter your trading details in the light blue sections, starting in the top left with the base starting equity, the level at which you would stop trading the system if the account equity fell below it and the average number of trades per year:
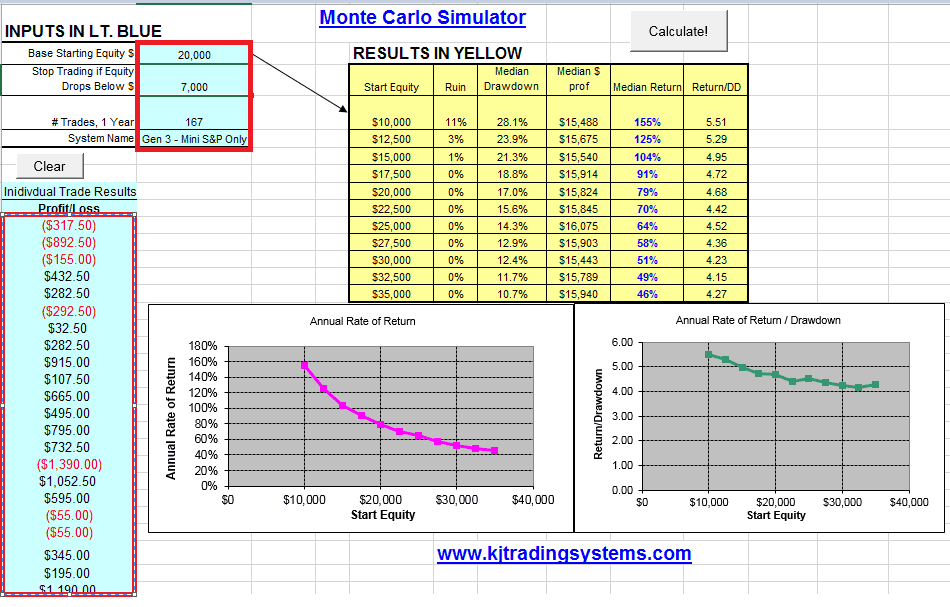
To enter your trades into the simulator press the ‘Clear’ button and paste the list of trade profit and loss in $ from your backtest report.
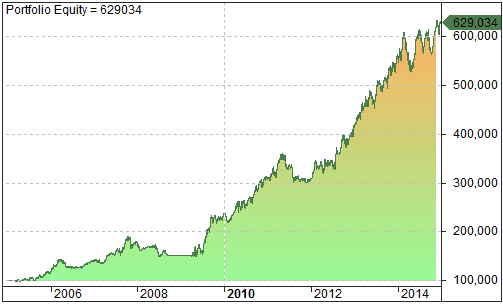
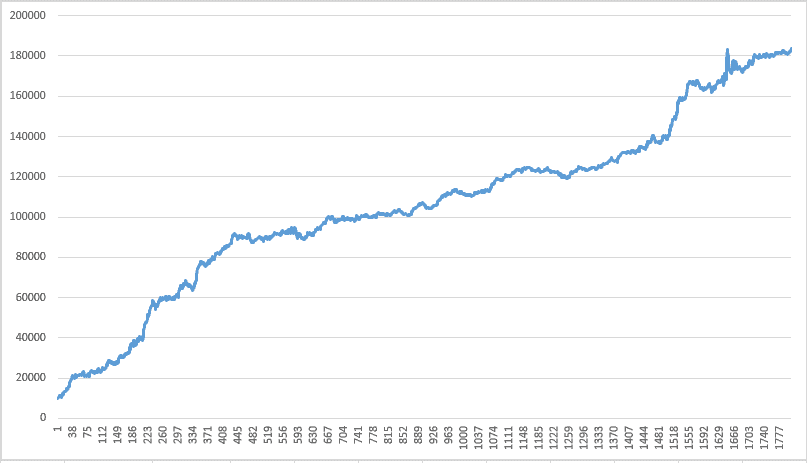
For this example we’ll use a list of 1805 trades over 10.5 years. Based on a $10,000 starting balance the CAR is 31% and Maximum Drawdown is 11%, which results in quite a smooth equity curve:
The results may seem impressive but let’s run it through the Monte Carlo simulator. By adding the trades into the simulator and pressing the Calculate button, the simulator runs through the list of trades 2500 times, randomising the sequence of trades each time. We’ve set a starting equity of $10,000 to match the backtest and the stop trading level has been set to $8,000.
The results from the simulator are very interesting.
Analysing the results
We’ve run the trade list through the Monte Carlo simulator and now it’s time to compare the results with the backtest:
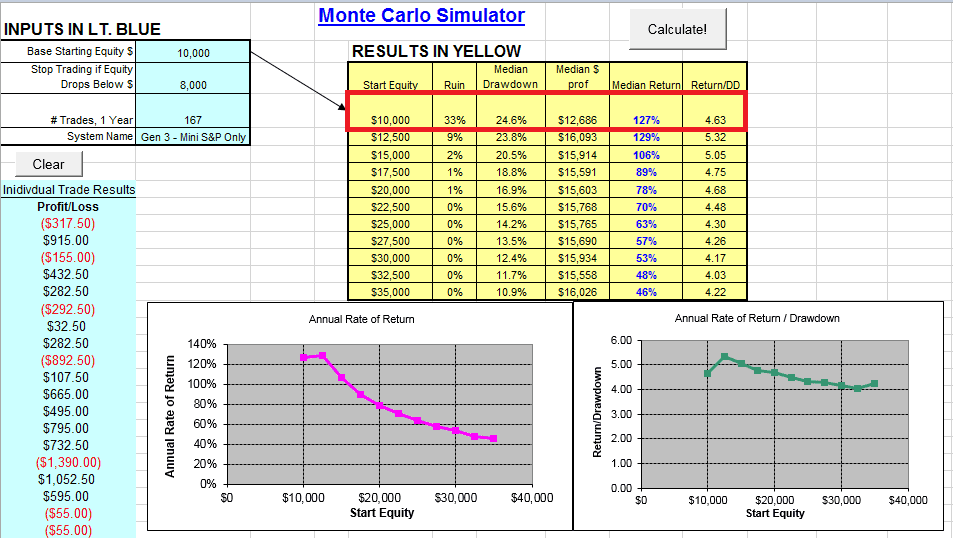
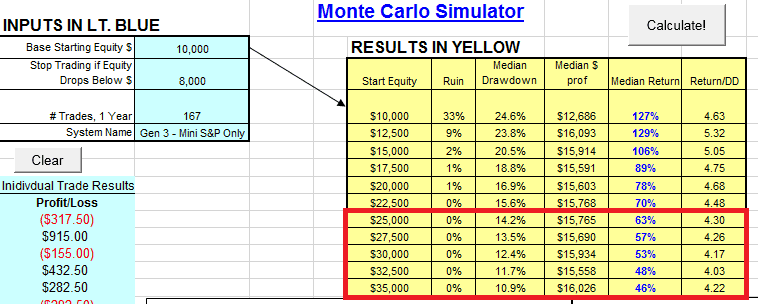
The first thing to notice is the Median Drawdown for the Monte Carlo simulations is 24.6% however the backtest reported a Maximum Drawdown of 11%. How can this be?
By switching the order of the trades we’ve identified the strategy actually contains more risk that the backtest report shows. The favourable sequence of trades in the backtest is understating actual risk!
Also, if the backtest report only produces a drawdown of 11% but the Monte Carlo Median Drawdown is 24.6% there are likely sequences of trades that have produced 50% drawdowns or larger, much higher than the drawdown limit of 20%.
Note that trading this strategy with a $10,000 starting balance has a 33% chance that it will meet or exceed the 20% drawdown limit. This risk of ruin is much too high.
Applying the results
The Monte Carlo results have shown that starting with a $10,000 account and a 20% drawdown limit we have a 33% chance of ruin and the Median Drawdown of 24.6% is higher than our drawdown limit. What can we do about this?
Without adjusting the strategy rules or risk per trade it seems the best approach is to start with a higher account balance. By checking the yellow results table in the Monte Carlo simulator we can see that we should probably trade this strategy with $25,000 or higher:
Conclusion
We can now see the importance of Monte Carlo analysis in the system development process. This basic example has shown us how backtest results, which only show the performance of one order of trades, may not be showing the full picture.
By running the trade list through the Monte Carlo simulator we’ve determined:
- The Maximum Drawdown value in the backtest report (-11%) was based on a favourable run of trades and was understating the actual risk of drawdowns, with the Monte Carlo simulations showing a Median Drawdown of -24.6%
- The Risk of Ruin when trading a $10,000 account size was 33%, much too risky to trade, so a larger account size or smaller trade risk would be required to reduce the possibility of ruin.
Download it

Want to get the latest updates automatically?
The best way to get notified when new stuff is released is to sign up to the email list below, we’ll be sure to let you know:
[mc4wp_form]